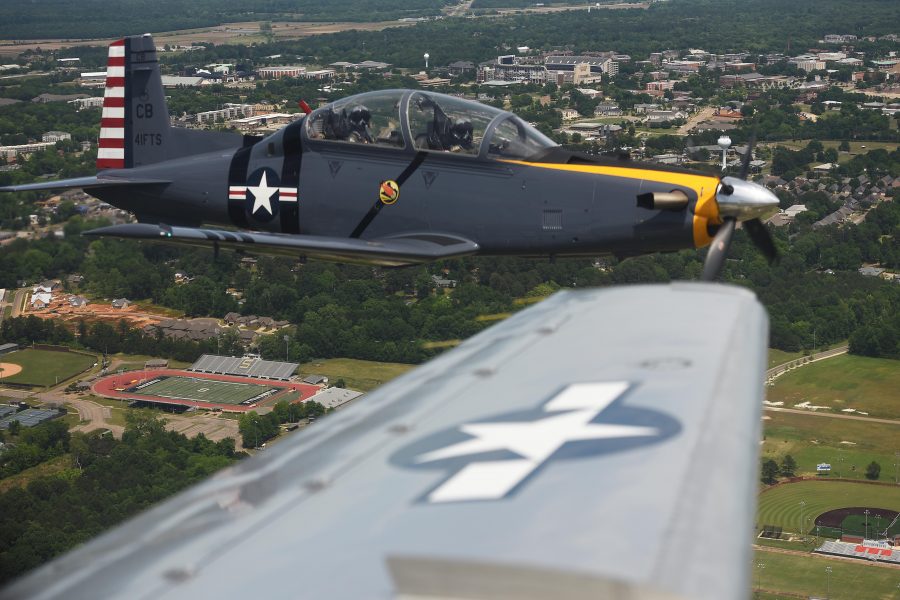
The Air Force saw a total of 33 hypoxia-like events in its T-6A Texan II trainer fleet in fiscal 2020—a nearly 20 percent decrease from fiscal 2019—Air Force Safety Center data obtained by Air Force Magazine shows.
However, the rate of these events—defined as the number of incidents per 100,000 flying hours—within the T-6A fleet increased slightly over fiscal 2019.
And while the T-6A fleet generally saw three or fewer physiological episodes per month in fiscal 2020, the data showed event spikes in November 2019 (six events) and April 2020 (seven events).
Monthly Physiological Episode Totals in Fiscal 2020
| Number of Physiological Episodes | |
| October 2019 | 3 |
| November 2019 | 6 |
| December 2019 | 1 |
| January 2020 | 2 |
| February 2020 | 2 |
| March 2020 | 1 |
| April 2020 | 7 |
| May 2020 | 2 |
| June 2020 | 1 |
| July 2020 | 3 |
| August 2020 | 3 |
| September 2020 | 2 |
The Air Force recently made progress on its quest to determine the cause of hypoxia-like events in its T-6A fleet—including ruling out contaminated air as the culprit and putting a greater focus on the potential role of rapid fluctuations in in-flight oxygen levels—but the puzzle has yet to be solved.
How Other Fleets Fared in Fiscal 2020
While the Air Force didn’t provide other fleet-specific physiological episode totals for fiscal 2020, the Air Force Safety Center data showed that the rates observed in the F-22A, F-15C/D, and F-16C/D all decreased from fiscal 2019.
Rates of Hypoxia-Like Events Across USAF Fleets
Per 100,000 Flying Hours, Fiscal 2009-2020
| F-22A | F-15C/D | F-16C/D | A-10C | F-35A | T-6A | |
| Fiscal 2009 | 9.53 | 0.00 | 3.11 | 3.24 | N/A | 1.89 |
| Fiscal 2010 | 8.11 | 5.08 | 1.63 | 1.03 | N/A | 2.76 |
| Fiscal 2011 | 65.41 | 2.76 | 2.67 | 0.00 | N/A | 1.05 |
| Fiscal 2012 | 56.59 | 4.72 | 4.83 | 1.97 | N/A | 3.38 |
| Fiscal 2013 | 19.14 | 7.67 | 3.68 | 2.12 | N/A | 0.60 |
| Fiscal 2014 | 6.68 | 4.92 | 5.62 | 3.59 | 37.54 | 1.19 |
| Fiscal 2015 | 6.25 | 29.28 | 6.16 | 4.59 | 13.39 | 2.48 |
| Fiscal 2016 | 16.19 | 49.46 | 5.77 | 2.49 | 17.63 | 1.74 |
| Fiscal 2017 | 2.96 | 12.54 | 7.89 | 7.25 | 67.64 | 3.98 |
| Fiscal 2018 | 10.41 | 17.91 | 8.62 | 6.52 | 23.84 | 55.83 |
| Fiscal 2019 | 14.57 | 24.17 | 4.17 | 2.56 | 15.43 | 23.77 |
| Fiscal 2020 | 3.68 | 8.24 | 3.70 | 4.07 | 22.50 | 23.83 |
The service’s F-22A and F-15C/D fleets saw the most dramatic drops from fiscal 2019, with the F-22A fleet’s rate of physiological episodes decreasing by nearly 75 percent and the F-15C/D fleet’s rate down about 65 percent.
However, the Air Force’s A-10C and F-35A fleets saw their rates of hypoxia-like events rise in fiscal 2020, the data showed.
The Thunderbolt fleet saw an approximately 59 percent uptick in its physiological episode rate over fiscal 2019, while the F-35A fleet saw an increase of about 46 percent.
An Air Force investigation published Sept. 30 found that an onboard oxygen issue contributed to an F-35A crash at Eglin Air Force Base, Fla., on May 19.
“For the A-10 and F-35 fleet, an increase of one or two physiological episodes per 100,000 hours does make a statistical impact, but the number of episodes in each aircraft remains low,” wrote Air Force spokesperson Lt. Col. Malinda Singleton in a Dec. 10 email to Air Force Magazine. “Our goal is to drive the number to zero episodes per 100,000.”
Editor’s Note: This story was updated on Dec. 10 at 6:12 p.m. EST to include new information from the Air Force.
